
Discovery/Shock model
To recap, what do we know at this point?
A) We know that oil exploration efficiency has progressively improved over time; every year we critically evaluate bigger and bigger swaths though the earth's crust, looking for new deposits of oil. Unfortunately, the peak discovery years likely occurred during the early 1960's and we have since started exploring the fringes of oil's geological range. This has contributed to a monotonically diminishing rate of discovery, albeit somewhat mitigated by reserve growth.
B) We also know that once we discover a new reservoir of oil, it takes a while to start pumping and then to pump it dry. We obviously have to consider that some period elapses as the region sits fallow, that some period elapses as extraction facilities get constructed, and that some period elapses as the new rigs come online and reach maximum production. These three factors have some average value that we can make an educated guess at. We can also guess at an average extraction rate that works out proportional to the amount of reserve that we have left. This extraction rate, more than anything else, responds fairly quickly and agilely to market and political considerations.
C) We know that a good discovery model should help us quantitatively describe (A) and that a good extraction model should help us describe the dynamics of (B). With some work, we have arrived at a unified Discovery/Shock model which captures this knowledge mathematically.
Qualitatively we have this set of parameters:
- Discoveries first started in 1858 (the year t=0)
- Swept volume increase per year = k*t3
- Total volume and fraction containing oil = fV0 = D0
- Fallow period = 5 years
- Construction period = 5 years
- Maturation period = 5 years
- Extraction rate = ?
Khebab posted a discovery profile that demonstrates how backdating affects the historical record. Basically, much like what happens with economic metrics, what gets reported today may grow in the future.
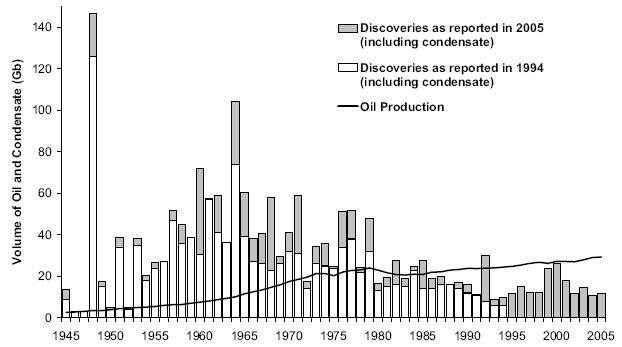
We can clearly make out a peak in the early 1960's. We compare it to the well-known smoothed discovery profile superimposed on an oil production curve popularized by Laherrere.

I fit a yearly discovery model to Khebab's backdated data assuming a cubic growth model of constrained limit 3430 billion barrels (D0) and an acceleration term of 0.033 (k).
dD/dt = 4kt3*(1-exp(-D0/kt4)*(1+D0/kt4))The green curve below shows discovery growth and decline superimposed on the non-backdated data in red. Note that reserve growth will conservatively fill in the tails to the right of the peak according to the model.

For the shock model production curve, I applied the discovery model as stimulus and used the perturbations in the extraction rate as shown below.

The blue and black curves suggest two possible future trends, a status quo on extraction rate starting at year 2005 that leads to an immediate decline or a monotonic increase in extraction rate that will stretch the peak out slightly beyond the 2020 time frame. In the past I had used extraction rates approximately double those shown, but I had little insight into a discovery model at the time that could predict potential in reserve growth nor did I have a straw-man extrapolated curve from pre-war discoveries. The extra cushion provided by a gradual modification of extraction rate makes me believe that we could keep up an undulating plateau for several years. In fact, just by increasing the extraction rate linearly to 0.035 until 2050, we could likely achieve a plateau until 2025 and a faster decline thereafter. This always boils down to the adage "pay me now or pay me later"; whatever extra production we can get now eventually comes back to bite us as a steeper decline on the backside.

The big if remains whether the discovery model will correctly predict the backdated reserve growth. The equivalent URR that I fit to, 3.44 trillion barrels, reflects a value significantly higher than the 2.7 often bandied about. You can see how conservative this estimate becomes when plotted against another of Laherrere's graphs of cumulative discoveries (which has a URR of only 2.0 trillion barrels).

After doing this exercise, as you can probably tell, I've become even more of a fan of the term "undulating plateau". The cushion of potential discoveries in the future provides a modicum of slack to keep on doing what we do as consumers. Enough slack in the rope, perhaps, to hang ourselves with.
posted by @whut at May 22, 2007
![]()
![]()


8 Comments:
Hi,
The notion that technology, new discoveries and reserve growth can someway arrest the decline in conventional oil to only an undulating plateau seems a very optimistic assumption to me, especially since it appears that almost all of the conventional oil to be found has been found.
Even if this were the case extreme price volatility (price shock) in a regime of little to no growth in the oil supply, when we're seeing an annual increase in demand of 1.5 to 2% p.a., would probably be enough to derail the whole consumption bandwagon anyway. This event would occur much sooner than the ultimate production peak or slide (supply shock) in the 2025 timeframe your model postulates.
Best Regards,
John
Don't shoot the messenger.
Just trying to get a handle on what is being cryptically reported regarding discoveries. This info is held so close to the vest as to drive us all nuts.
Don't shoot the messenger.
WHT didn't mean to come over that way. So where is all the undiscovered supposed to be lurking? (Confused)
Cheers,
John
The way to explain it is to consider that we have to oversample a finite, yet perhaps fractally constrained, volume by progressively exploring bigger and bigger volumes. Only by oversampling can we critically appraise all regions. In other words, the law of diminishing returns sets in as those larger and larger volumes uncover potentially smaller pockets of oil. The spreading out over time occurs naturally as we have as much uncertainty in the size of the volume that we are sampling as we have in the variance in the size of the volume (which is standard practice to do if you don't have data to support what the sampling volume is). That's what gives us those long tails and a higher URR.
This whole idea fits in well with reserve growth in a single region:
http://mobjectivist.blogspot.com/2007/04/apparent-reserve-growth.html
http://www.myaskblog.info
http://www.geekoblog.info
http://www.articlemag.info
I'm also confused. If I understand correctly, you are saying the higher URR is a result of vague or incomplete discovery data, but you also seem to be saying that you have deliberately overestimated the discovery curve because you think it likely that reserve estimates will actually grow that much. I've read through the post several times and it's not at all clear how you arrived at your estimate of 3.44 trillion URR. Can you clarify? Thanks!
...it's not at all clear how you arrived at your estimate of 3.44 trillion URR. Can you clarify?
Yes please as this is even more optimistic than the USGS 2000 report. (Still confused)
Regards,
Tony
It is all found in the long tails, which is where reserve growth typically occurs. The fit is to the first data set shown for CumulativeDiscoveries(2005) - CumulativeDiscoveries(1945) = D(2005) - D(1945) which is not too hard to solve for.
Post a Comment
<< Home