
Laherrere Interview
TOD Europe published an interesting interview with Laherrere:
TOD:E : Like other researchers (e.g. Hubbert, Marchetti) you use extensively the Logistic analysis as a predictive method, even though not everyone appreciate it as much. What makes you rely so much on the Logistic curve?Laherrere has clearly used this "discovery shift" analysis in many of his figures. This natural gas curve shift looks rather startling:
JL : Contrary to many researchers I use a several cycles model, I do not trust the Hubbert Linearization if the plot is not linear for decades. I use the derivative of the logistic function as model for each cycle because it is the simplest to plot using the peak value of the cycle, the peak date and the width of the cycle in years. Any other bell-shaped curve, as the Gauss (normal) curve, will work as well. I fit the last cycle to the last production value with the last trend (slope).
But I add in the text that this curve is to show simply what the geology can offer with the ultimate being the surface below the curve. But the supply has constraints from investment, politics, wars, insecurity and other constraints of the demand (high prices or recession). Any curve with the same surface below can fit depending the constraints. This is why I was also the first one to speak about a bumpy plateau instead of a peak.
What is important is to give the reader a production curve which has a surface below the curve equal to the ultimate. The curve can be modified to satisfy the constraints as long as the surface is conserved: any area below the model should be compensated by an equal area above the model. Most of forecasts are showing short periods before and after present, when mine are from the beginning to the end.
Hubbert in 1956 was modelling bell-shaped oil production by hand without any equation (he adopted the logistic curve much later) and he was saying that the production curve mimics discovery curve with a certain lag. He was right and often I do not model production, I just show production and shifted discovery to guess the future production by looking at the discovery curve which is ahead of the production time, as for example the natural gas of North America in the above graph in the NG chapter.
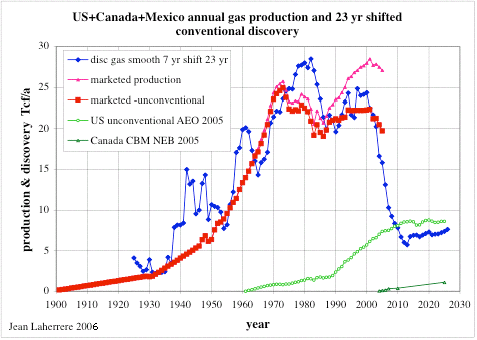
As a caveat, note that Laherrere also performs a moving average filter on his discovery data, so that his shift has some stochastic elements. I wish he would remove the moving average so I could apply the shock model to it a bit more formally.
Compare to a recent post I made here on shifts in a discovery model to model production (recent as in before a vacation-induced dormancy).
posted by @whut at August 07, 2007
![]()
![]()


0 Comments:
Post a Comment
<< Home