
GOM Maximum Production Rate and Macondo
I did some analysis based on Berman's post from a few days ago:
(Estimated Oil Flow Rates From the BP Mississippi Canyon Block 252 “Macondo” Well)
I think he messed up the statistics because of his use of a truncated data set from the MMS and the log-normal distribution he used.
I wasn't sure exactly how he got his data but I essentially had to screen scrape the data off of about 18 PDF files giving the Maximum Production Rate (MPR) going back to 1975: http://www.gomr.mms.gov/homepg/pubinfo/repcat/product/MPR.html
I plotted the results histogram against a model of dispersive aggregation for reservoir sizes. The maximum rate is then a simple proportional draw-down from the reservoir size. Bigger reservoirs have a higher rate and smaller reservoirs have a smaller rate -- nothing to argue about here as it is a pretty safe approximation. The way you read this histogram is that the flat regions have the highest frequency.
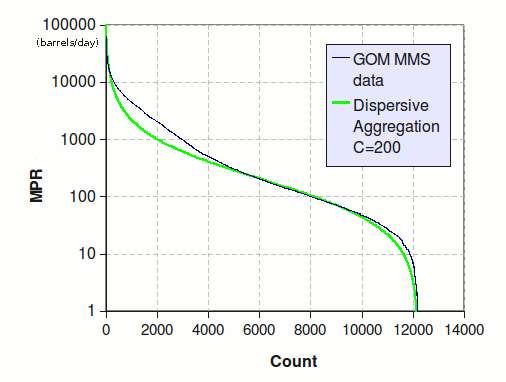
The integrated underneath the two curves is equal and about 16.5 million barrels per day peak. Don't confuse this with any rate attainable from the GOM; it is high because it sums up the peaks from a span of years. The median value is 200 barrels per day.
The interesting point in the curve is that the model predicts a higher peak rate for the largest reservoirs, the curve goes off the graph to above 400,000 barrels per day. Now, I would think that the operators would never try to have that throughput from a single well. So what do they do? Of course they split it into several wells to extract the maximum amount from that reservoir and essentially throttle that from an individual well.
Since the total amount is conserved between the two curves, the bulge that you see in the data is the extra wells drilled to make up for the excess. My model is totally based on the principle of Maximum Entropy applied to reservoir sizing, and the reordering of the rank histogram is caused by artificial constraints set by human intervention. Notice that all the small reservoirs effectively require no throttling.
The point of this comment is that working wells are likely throttled but the Macondo could conceivably be higher than the maximum of 50,000 barrels per day that Berman suggested. The operators have no way of throttling it until the relief wells are put in place. Of course this kind of throughput is very rare, as at the most a couple of dozen out of 10,000 reservoirs will get this big and generate this potential, but this is the way that nature operates, a big fat-tail effect.
posted by @whut at July 01, 2010
![]()
![]()


4 Comments:
I got the feeling the Mr Berman was being disingenuous. He was taken to task for comparing blowouts to production wells. There appeared to be a lot of points where his argument could be dissected. Obviously, the pressure issue was not even mentioned.
Maximum production from a completed well versus max output from a blowout that damages the formation was not examined.
The nature of the well; a continuous casing to the reservoir with an eroded and possibly seriously compromised well head was also not examined.
It's impossible to say what BP would have done if this well had been completed successfully; perhaps three or four additional taps would have been made into the formation as was done with Thunderhorse. Since BP isn't tellin' it is reasonable to assume (guess) that Macondo is a very large reservoir.
Otherwise, why not release the geology of the formation?
On the other hand, BP's pinch- penny approach seems to suggest that they didn't think they had a 'whale' of a field otherwise they would have been more careful of it.
Which leads back to Berman who make generalizations about fields but cannot be specific about this one.
Good points. Pressure of the formation has got to be critical and this explains why the throttling has to occur. At huge rates, I don't think they can keep up with collecting the flow out.
Otherwise, I see this kind of analysis as a bit of DNA-type forensics. We are just looking at it from the perspective of the odds of something this big coming from the population as a whole. Most of the reservoirs are full-throttle proportional drawdown except for the really big ones which they have to throttle. Not knowing a lot about the mechanics of the engineering, this is what the data is telling us.
I think that Berman was on the right track but made some mistakes along the way on how he interpreted the data. I wish the MMS data was easier to get at as the PDF reports are a mess.
You've doctored the graph by not using a normal scale, go up to 100,000 by 10,000 incriments that would show a better representation,
Or better still show it in proper scale from 1 to 100,000, oh thats right, you wouldn't have enough room to do that because you'd need 100,000 marks on the left hand scale,
Your not helping your cause by attempting to be deceiptful,
"You've doctored the graph by not using a normal scale, go up to 100,000 by 10,000 incriments that would show a better representation,
Or better still show it in proper scale from 1 to 100,000, oh thats right, you wouldn't have enough room to do that because you'd need 100,000 marks on the left hand scale,
Your not helping your cause by attempting to be deceiptful,"
So plot it yourself! There are only so many ways to show the large dynamic range of the rates.
Plus, I am not sure what exactly you are belly-aching about that demonstrates the deceit! Do you have your own theory?
Post a Comment
<< Home